Capybara Integration Test Debugging Tips

I ran into this today when writing an integration test for a JS intensive flow:

5 Capybara Debugging Tips

There’s a few good tips here: Five Capybara Hacks to Make Your Testing Experience Less Painful which I’ll summarize:

  1. Run a script: page.execute_script("<some js code>")
  2. Tails the test log tail -f log/test.log
  3. Use pry to get a view into the browser:
    puts current_url; require 'pry'; binding.pry
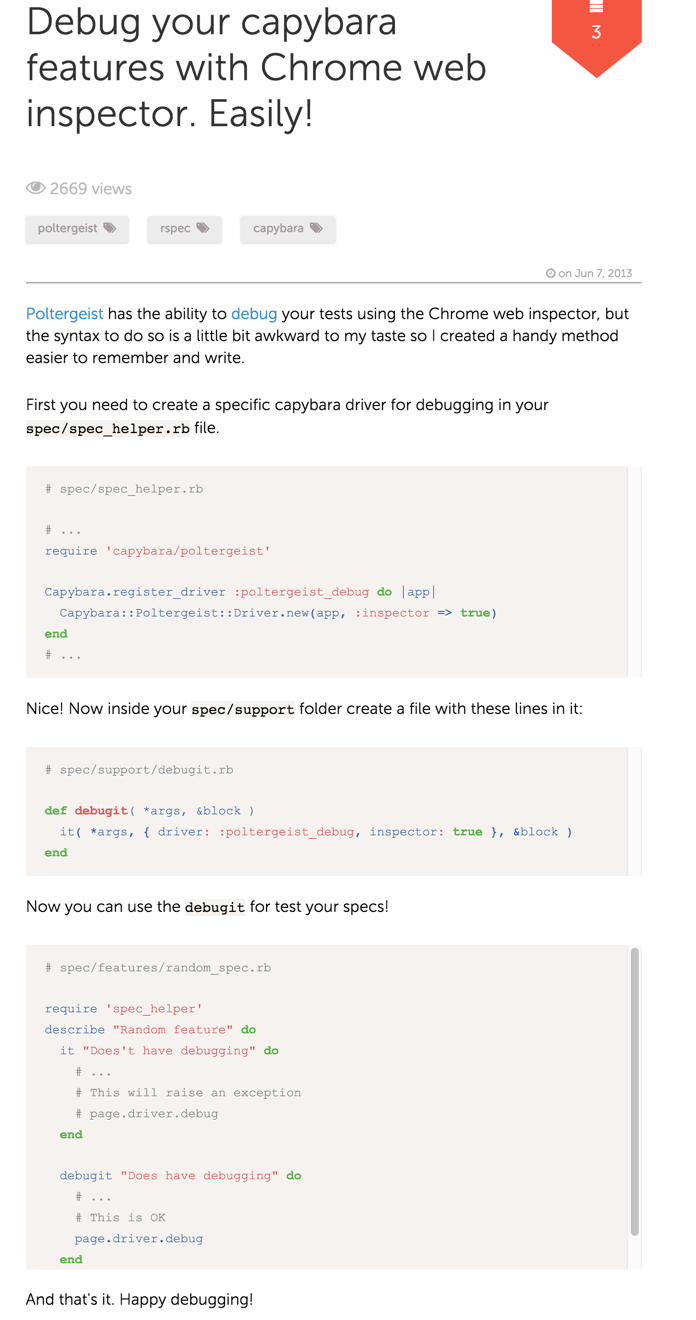
    Definitely take a look at this article: Interactive Debugging With Pry. The key thing to know is that ctrl-d makes your test continue and that the you can visit the URL that prints in Chrome. If your test depends on a
  4. Make Sure DatabaseCleaner Plays Nice with PhantomJS (check the article mentioned above and my article: Capybara, PhantomJs, Poltergeist, and Rspec Tips
  5. Split VCR/Webmock Specs Into a Separate Rake Task From Your JavaScript Tests. I haven’t tried this one yet.

Logging into Capybara/PhantomJs Browser with a User and Password

Here’s a nifty extension to step 3, as my tests typically depend on a logged in user.

First, I define this method for login_as_user, in spec/support/capybara.rb

include Devise::TestHelpers
# gives us the login_as(@user) method when request object is not present
Warden.test_mode!

def login_as_user(user = nil)
  current_user = user || Factory.create(:user)
  login_as(current_user, :scope => :user)
  @current_user = current_user
end

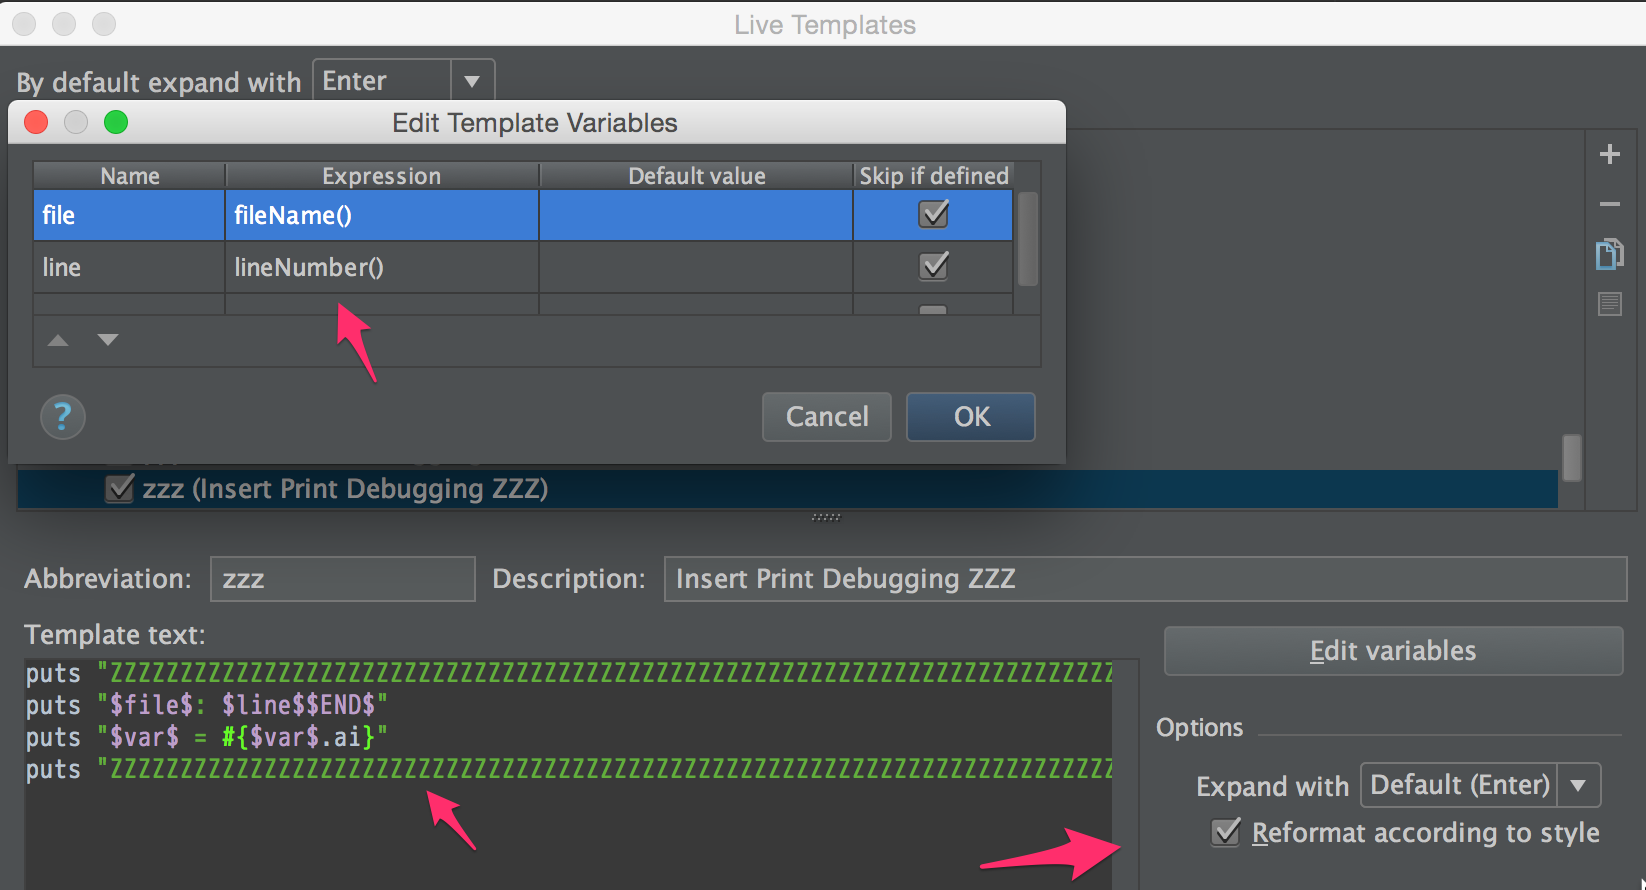
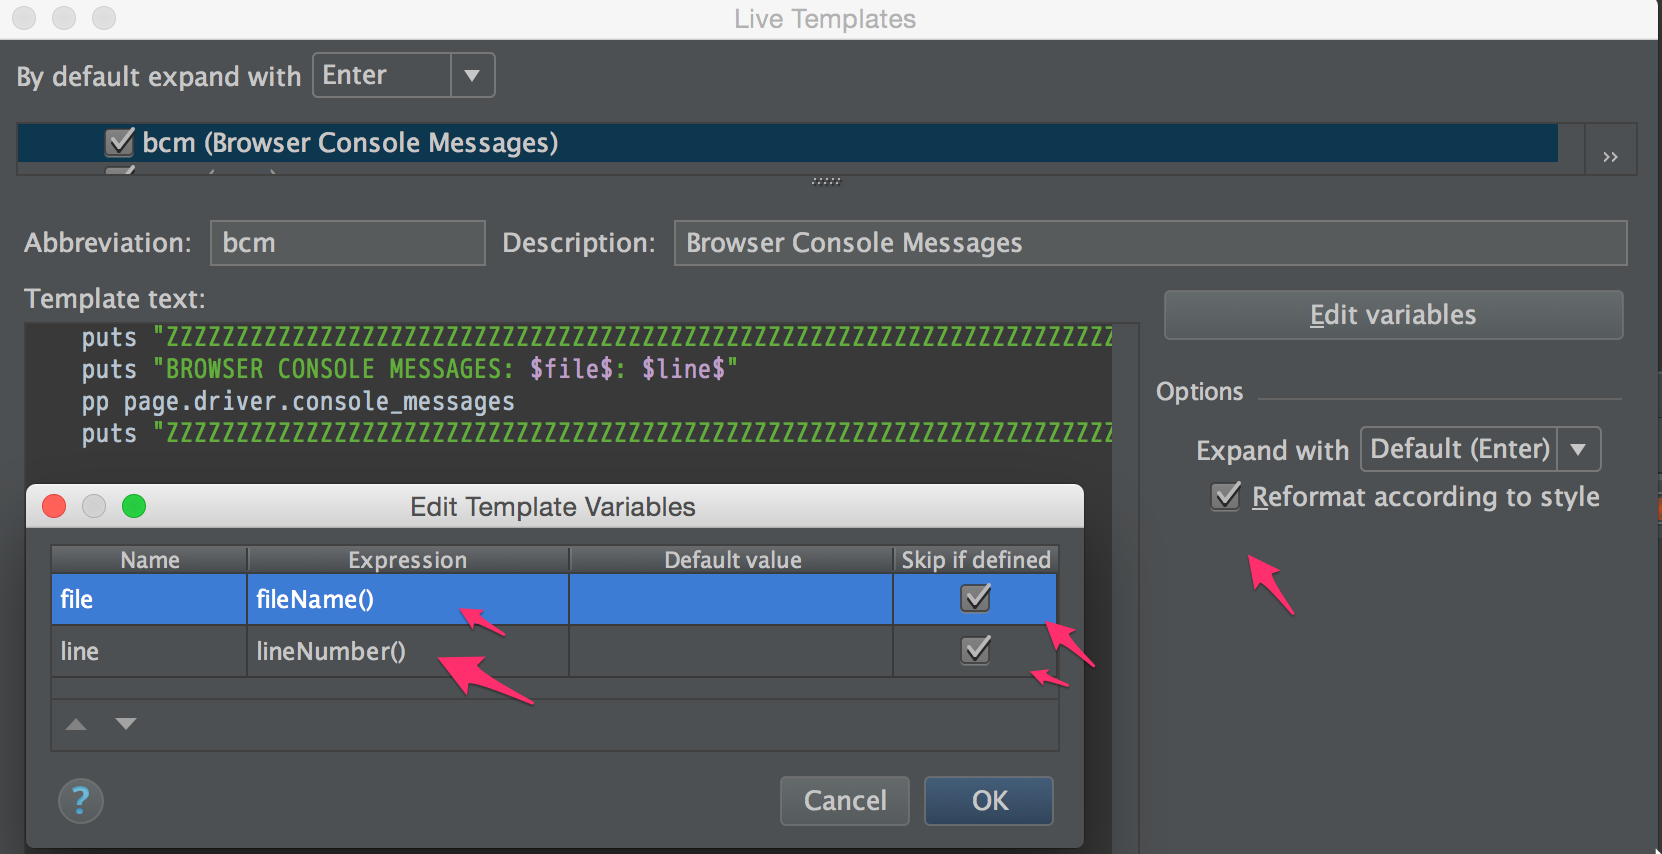
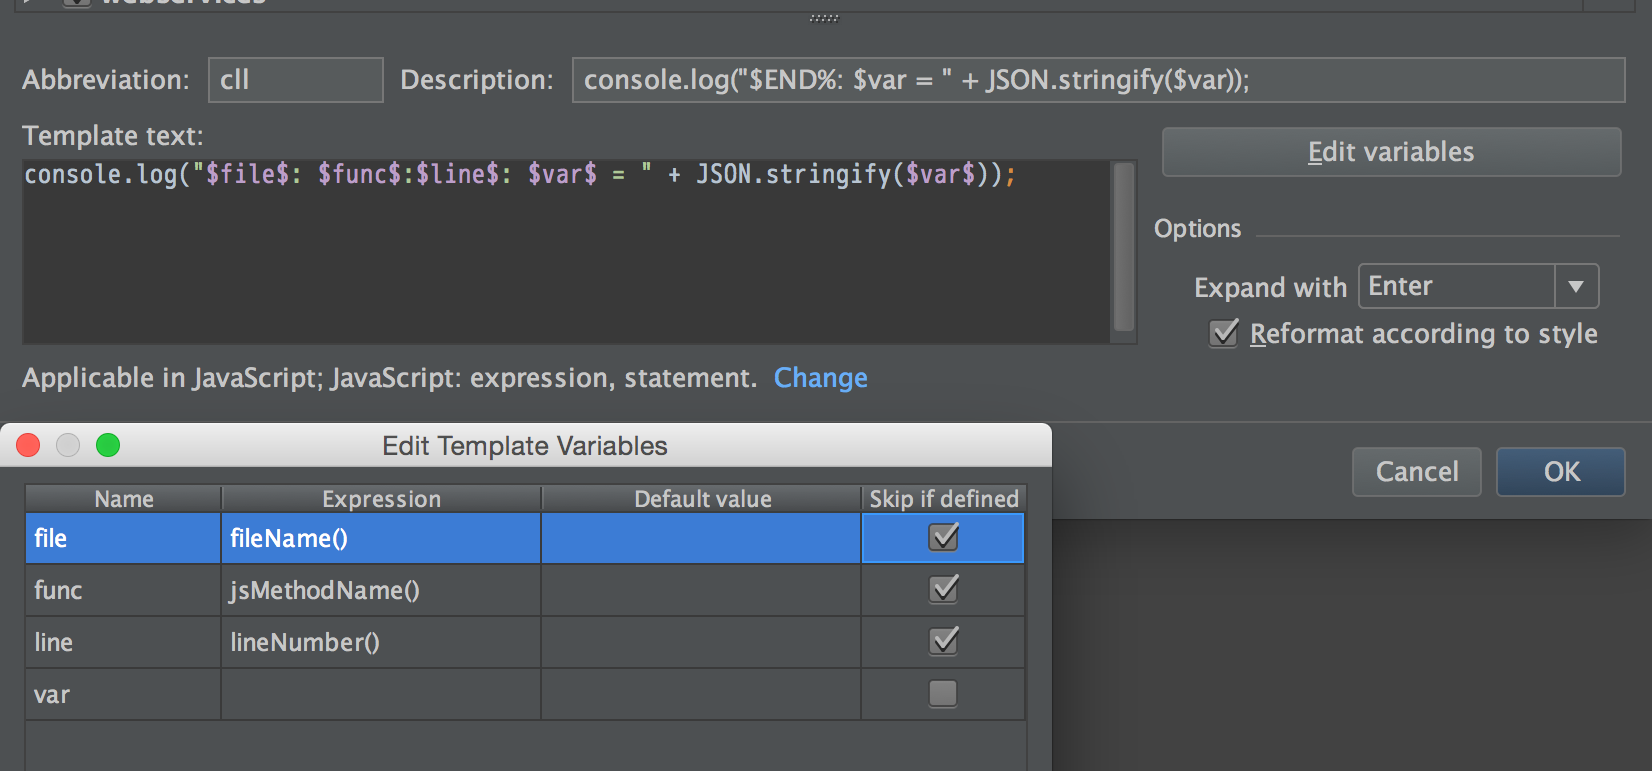
Then I create this “Live Template” in RubyMine with abbreviation pryr:

puts "ZZZZZZZZZZZZZZZZZZZZZZZZZZZZZZZZZZZZZZZZZZZZZZZZZZZZZZZZZZZZZZZZZZZZZZZZZZZZZZZZ"
puts "user: #{@current_user.email}, password: #{@current_user.password}"
puts current_url
puts "ZZZZZZZZZZZZZZZZZZZZZZZZZZZZZZZZZZZZZZZZZZZZZZZZZZZZZZZZZZZZZZZZZZZZZZZZZZZZZZZZ"
pause

See below for the definition of pause or see this.

And then when I put this in a test, I get the URL, as well as the user/password to troubleshoot the issue.

Much better than save_and_open_page

This can be much better than using save_and_open_page or rendering the page. Not only can you inspect variables, but you can test your your capybara commands on the browser page. Try doing a click_link "some link" and your Chrome browser move as if you clicked on the screen!

And then you’ll be all set to efficient write more integation tests!

UPDATE: 4/9/2015: You want to now use byebug rather than binding.pry.
UPDATE: 2/10/2016: See thread below on using pause or see this. You should use driver :selenium if you want to pause, and you don’t need to login.

Note, it seems that this technique of using pry is incompatible with Zeus. So just use rspec rather than zeus rspec.

Just had to do some intensive test writing. Here’s a few notes.

  1. The gem capybara-screenshot is super useful. After each test failure both an image and an html file are placed in /tmp/capybara. I tended to use the HTML files even more than the images. This seems faster than going in with pry, as show in the prior post. Make sure that you’ve got js: true where your feature is defined.
  2. If you think you’re bug free and then go about writing lots of tests, I guarantee that you’ll find some bugs. It’s sort of like proof reading your term paper backwards, one word at a time. You catch things that you previously missed.
  3. You can share a file of methods among several feature specs by creating a file with the shared methods and simply doing a require_relative("./my_shared_methods") in your feature specs that will use the shared methods. This is a great way to DRY up your feature specs.
  4. I like to first get really good non-feature spec coverage, mostly at the model level. And then I like to very thoroughly cover the code with Capybara specs.

Here’s a few more key tips for interactive debugging with pry and capybara:

  1. Want to log to the console:
page.driver.execute_script("console.log(\"foobar\");")

That shows up in your terminal, not the browser console.
2. Want to click on a link or take some action? Well, you can’t see the change in the browser you just opened. The browser you just opened does not update dynamically for actions taken in the pry console.

You can, however, call something like this

screenshot_and_open_image

That will give you the path of the image to open. If you have your finder set to the tmp/capybara directory, you can see the image there.

I created this helper method:

# See top of $project/spec/features/calendars_spec.rb for advice on how this was used.
# To use this method:
# Put in debugging call `pry!` before the event that you think should work fails.
# In the pry console:
# Invoke capybara actions, such as
#   page.driver.click 500, 300
# Then after each call,
# call
#   screenshot_and_open_image
#
# Then with a finder window open to the $PROJECT/tmp/capybara directory, you'll be able to see
# when the right coordinates result in the new appointment dialog
def pry!
  puts "ZZZZZZZZZZZZZZZZZZZZZZZZZZZZZZZZZZZZZZZZZZZZZZZZZZZZZZZZZZZZZZZZZZZZZZZZZZZZZZZZ"
  puts "user: #{@current_user.email}, password: #{@current_user.password}"
  puts current_url
  puts "ZZZZZZZZZZZZZZZZZZZZZZZZZZZZZZZZZZZZZZZZZZZZZZZZZZZZZZZZZZZZZZZZZZZZZZZZZZZZZZZZ"
  require 'pry'; binding.pry
end

And once you are in the pry mode, not only can you call screenshot_and_open_image, but you can also do a save_and_open_page (which I aliased as page!). This came in extremely handy when I had to figure out this xpath to match on an autocomplete result, leading to the discovery of the long xpath shown below.

def fill_in_autocomplete(selector, value)
  script = %Q{ $('#{selector}').val('#{value}').focus().keydown().keypress() }
  page.execute_script(script)
end


def choose_autocomplete(text)
  expect(page).to have_xpath("//div[contains(@class, 'tt-suggestion')]//p[text()[contains(., '#{text}')]]", visible: false)
  script = %Q{ $('.tt-suggestion:contains("#{text}")').click() }
  page.execute_script(script)
end

some other ways to do it:
puts ‘Z’ * 60
puts ’ password test '.center(60, ‘Z’)

My tip is: 1) do as little Capybara/JS testing as you can get away with, because Capybara/PhantomJS is slow and sometimes glitchy. And 2) do lots of Jasmine unit testing - very fast, very reliable and you can spec out every aspect of your JS code.

Drive JS unit tests with something like ‘teaspoon’ or ‘jasmine-rails’, use Guard with one suite for your JS tests and one for Ruby tests. Then you can run all JS and RB tests in one shot.

@justin : RE:

Poltergeist also has a nice interactive debugging feature (experimental): Poltergeist 0.6.0: Javascript error handling and remote debugging - Jon Leighton

To use it - just set your driver to poltergeist_debug

Capybara.register_driver :poltergeist_debug do |app|
  Capybara::Poltergeist::Driver.new(app, :inspector => true)
end

# Capybara.javascript_driver = :poltergeist
Capybara.javascript_driver = :poltergeist_debug

Then you can debug the page in a browser with this line:

page.driver.debug
1 Like

Here’s a few random notes from some testing research as of 2015-09-06.

  1. Debugging
    You still can’t beat putting in fenced debugging statements. Also, clear the logs and then re-run the test. Read what’s in log/test.log and the console very carefully!

  2. Page Objects
    I’ve seen @geoffevason using lots helper files to encapsulate common blocks of code. This is a bit different than “Page Objects” that encapsulate the page. Here’s a good article on that: 6 Ways to Remove Pain From Feature Testing in Ruby on Rails. The difference is that Geoff’s technique is simply encapsulating the common chunks of logic in helper methods. The page object technique is more about encapsulating the logic of the page.

  3. Debug print the JS console messages
    If you’re using the webkit driver, then this bit of code works:

pp page.driver.console_messages

(pp is pretty print if you have awesome_print installed)

  1. Allow Quick Swapping of Capybara JavaScript Driver
    This is a neat bit of code to quickly change what driver you’re using for your tests. In general, it’s not very productive to go to this level. However, this is GREAT for confirming that some issue is driver specific, rather than a bug in your code.

Live Templates

Ruby

Printing a variable:

puts "ZZZZZZZZZZZZZZZZZZZZZZZZZZZZZZZZZZZZZZZZZZZZZZZZZZZZZZZZZZZZZZZZZZZZZZZZZZZZZZZZ"
puts "$file$: $line$$END$"
puts "$var$ = #{$var$.ai}"
puts "ZZZZZZZZZZZZZZZZZZZZZZZZZZZZZZZZZZZZZZZZZZZZZZZZZZZZZZZZZZZZZZZZZZZZZZZZZZZZZZZZ"

Printing the console messages in a test:

    puts "ZZZZZZZZZZZZZZZZZZZZZZZZZZZZZZZZZZZZZZZZZZZZZZZZZZZZZZZZZZZZZZZZZZZZZZZZZZZZZZZZ"
    puts "BROWSER CONSOLE MESSAGES: $file$: $line$"
    pp page.driver.console_messages
    puts "ZZZZZZZZZZZZZZZZZZZZZZZZZZZZZZZZZZZZZZZZZZZZZZZZZZZZZZZZZZZZZZZZZZZZZZZZZZZZZZZZ"

JavaScript

Here’s the JavaScript template to print a var. Note, the %O that works well in Chrome might not work for JS automation testing.

console.log("$file$: $func$:$line$: $var$ = " + JSON.stringify($var$));

I just came across this super useful article from Thoughtbot:

Write Reliable, Asynchronous Integration Tests With Capybara

If requests are served in a background thread, that means that your tests keep running while your application responds to simulated interactions. This provides for an endless number of race conditions, where your tests look for elements on the page which have not appeared yet.

@geoffevason Check this out: https://coderwall.com/p/gpro6g/debug-your-capybara-features-with-chrome-web-inspector-easily

# spec/support/debugit.rb

def debugit( *args, &block )
  it( *args, { driver: :poltergeist_debug, inspector: true }, &block )
end

However, I’m not sure what this debug mode really gives you of value. You can see the DOM, but you can also do that from capybara_screenshot.

This is an excellent article with many good tips:

Write Reliable, Asynchronous Integration Tests With Capybara by Joe Ferris of Thoughtbot

The article does a great job of explaining how both JS and non-JS tests run with Capybara.

The other main point is to understand the correct way to phrase your test assertions so that your test play well with the asynchronous nature of browser tests.

  1. You can’t pause the tests when using a headless browser. Switch to driver selenium or selenium_chrome
  2. Pause by using this, rather than binding.pry
# spec/support/pause_helpers.rb
module PauseHelpers
  def pause
    $stderr.write 'Press enter to continue'
    $stdin.gets
  end
end

# spec/rails_helper.rb
RSpec.configure do
  config.include PauseHelpers, type: :feature
end

And call pause in your test. Reference

@justin that’s a nice tool to have available in the toolbox. Thanks for sharing!

I know this is 3 years old its 2019 but i found a very simple way of a having and interactive debug session using selenium_chrome with full control of the browser using the Capybara DSL and binding.pry that i would like to share, Adding a before config like so:

config.before(:example, :js, :interactive_debug) do
    Capybara.current_driver = :selenium_chrome unless ENV['CI']
  end

Then when doing the tests add an argument :interactive_debug to the :context block or :scenario / :it block, for example:

context 'invalid user', :js,  :interactive_debug do
  it 'something' do 
    ...
    binding.pry
  end
  scenario 'something else' do
   binding.pry
   ...
  end
end

Or more specific like:

    scenario 'something specific',  :interactive_debug do
      login_as(user)
      visit '/dashboard'
      binding.pry
      click_on 'login'
      expect(page).to have_content 'The email or password are invalid'
    end

It works by temporarily switching to a “headed” driver. Works great for me.